Did you pull back on your investments last year, fearful the markets would stay down for a prolonged period? Trust us, you weren’t alone. Investors piled into cash-like securities during this time, pushing money market funds to record amounts.1 Unluckily for those sellers, the market has already clawed back much of last year's losses, as the S&P 500 was up 26% from Oct. 12, 2022 through Jun. 30, 2023.2
Here’s part of the issue that tends to drive this investor behavior: The stock market is generally a leading indicator of things to come. In other words, it usually moves first. But investors tend to be laggards, meaning they're slower to act. So there can be a timing mismatch between what the market generally does and what investors tend to do. The result is that investors often suffer from bad timing.
A distasteful cure?
Fortunately, we believe there’s a cure for bad timing—but it’s often quite distasteful. We recommend investors stay in the market—even if they must plug their noses, close their eyes, and swallow their fears. Because time after time after time…(you get the point), historical market data has shown the same thing: If you pull your money—and unfortunately, many do at or near the bottom—you could generally miss the best days of the market.
For example, if you missed the 10 best days over the last 20 years ending Dec. 31, 2022, your return would have been cut nearly in half—from a projected 9.8% if you remained fully invested to 5.6% if you missed the 10 best days. Why so drastic? Because seven of the 10 best days occurred within two weeks of the worst, with six of the seven hitting right after the worst day.3
But what if you moved to the sidelines like so many others?
Investors who took flight
If your fight or flight response kicked in and you chose flight, you may wonder when to return to the market. Despite missing the 16% run-up that's already happened this year, we believe the answer is now. The reason is threefold.
Reason 1: A bottom signal?
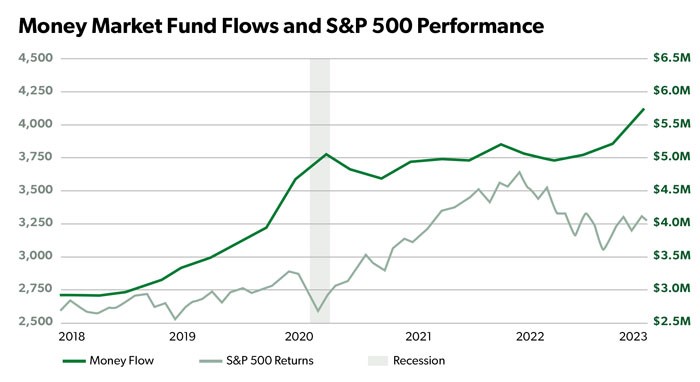
Data has shown that historically when money market fund assets have hit the top, markets were near or at the bottom.4 For example, money market assets peaked in May 2020, shortly after the market hit the bottom on Mar. 23, 2020. And during the financial crisis in 2009, assets peaked two months before the market bottomed on Mar. 9, 2009.
This chart shows the subsequent run-up three months after the 2020 peak of 41%. Similarly, in the three months after Mar. 9, 2009, the market rose 40%.
 Source: FRED.stlouisfed.org, Yahoo!finance, Data through Dec. 31, 2022. Left axis measures the performance of the S&P 500. Right axis measures money market fund flows.
Recently, money market funds reached a record $5.43 trillion, which feels "top-ish."1 Will the same trend persist this time? We cannot say with certainty that it will, but our second reason below explains why it could.
Reason 2: Simple economics
When investors on the sidelines jump back into the market, they could push it significantly higher. It's simple economic math, really. When demand rises and supply stays the same, prices rise. So, in this case, we feel prices should increase when lots of cash vie for the same supply of securities.
Reason 3: Time in, not timing
Regardless of when you enter the market, we believe your time in the market almost always delivers a higher return than timing the market. We say “almost always” because you could have been that lucky person who masterly timed your entry and exit. But for most investors, perfect timing is rarely achieved!
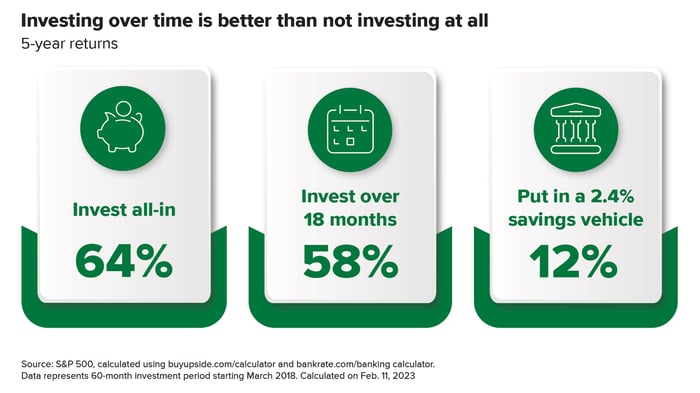
Let’s look at an illustration of the last five years in the U.S. stock market. It started with a down market (2018) and included a global pandemic that caused both a massive drop (2020) and a steep rise (part of 2020 through 2021), followed a year later by another double-digit decline (2022)—a volatile period to say the least.
So, for example, if Sasha (our hypothetical investor) had invested her total savings of $560K in a fund that followed the S&P 500 on Mar. 1, 2018, five years later (2023), she would have had $917K—a 64% increase.5 But if she tried to time the market and invested over the next 18 months, her portfolio would have been $883K—a 58% growth rate at the end of the five years.5 And if she decided to stay put on the sidelines, holding cash in a high-yield savings account yielding 2.4%,6 Sasha would have had $627K in five years—a growth rate of 12%.7
Sasha's example highlights five years with many twists and turns, backs and forths. Yet despite the upheaval, investing immediately and staying invested generated the highest results.
Avoid becoming a “bad timing” cautionary tale
Bad timing examples riddle history. For instance, on Sept. 16, 2008, Smart Money magazine released its newest edition with the headline "Double the size of your nest: Now is the time to invest in cheap stocks, funds, and real estate" on the same day the stock market collapsed roughly 30%. And on Jul. 24, 2001, Silverstein Properties purchased a 99-year lease on the World Trade Center for $3.2 billion, just about two months before the 9/11 attacks.
Obviously, the gravity of 9/11 is unparalleled, and we're not trying to compare your investment timing to such an event. But a comparable lesson prevails through these examples: You never know what may happen in the future. And to try to time the market is often considered a fool’s errand (and not the good kind of Fool! ).
).
That's why we recommend sticking with your wealth plan, even during difficult markets. And if you did sell and have cash on the sidelines, we think it's best to get back in the market today.
Again, you may have a once-bitten, twice-shy mentality. So to help invest while keeping your emotions at bay, reevaluate your wealth plan to ensure your risk is appropriate and you have adequate liquid cash to meet your spending needs should the market pull back.

Like what you're reading?
Join the thousands of readers getting stories like this delivered straight to their inbox every Thursday — for free. Give it a spin, enter your email to sign up.
Footnotes
1Money markets reached $5.43 trillion as of Jun. 30, 2023
2Yahoo!finance, data from Oct. 12, 2022 through Jun. 30, 2023
3JPM Guide to Retirement, Dec. 2022
4FRED and Yahoo!finance, data through Dec. 31, 2022
5Invested in SPY. Calculated by buyupside.com on Feb. 19, 2023
6Thebalance.com, Sept. 22, 2022
7Calculated by bankrate.com on a $560K account size, accessed on Feb. 19, 2023
Related Articles

What Does Inflation Mean for Your Wealth?
Rising prices are scary for many people, especially for those on fixed budgets. But while the...

Investments in a Down Market Still Tend to Outperform Savings Accounts Historically
What happens when a doctor recommends that you eat healthier? The reaction varies by individual....

Are We in a Recession?
Many people fear a recession. And for good reason! A recession generally means the economy is...

