
When most people shop for a big-ticket item—like a car, tv, or even a vacation—they fall along a buyer spectrum. At one end are shoppers looking for the least expensive goods irrespective of quality. And at the opposite end, shoppers seek the highest-quality good regardless of price. But many shoppers fall in the middle—searching for high quality at a reasonable price.
Investing in stocks is somewhat similar. Value investors tend to hold lower-growth, sometimes lower-quality, less expensive stocks with stable earnings. Growth investors tend to buy higher-growth, sometimes lower-quality, more costly stocks that may have no or less stable profits. But quality investors fall between the two—they aim for quality stocks at reasonable prices that often have higher expected growth, strong balance sheets, and stable, growing earnings.
Value, growth, or quality…which is best?
Interestingly, none of value, growth, or quality investing is inherently right…or wrong. There are market conditions that favor each. For example, 2022 rewarded value investors. But in 2021, growth investing was in favor. However, historically quality investing to us seems to prevail across many market environments.
.jpg?width=750&height=447&name=Quality-and-Growth-Offer-Strong-Returns-Over-Timev2%20(1).jpg)
Source: Capital IQ. The S&P 500 represents the broad market; the MSCI USA Growth Index represents Growth; the MSCI USA SECTOR NEUTRAL QUALITY Index represents Quality. Data from Nov. 30, 1998, through Sept. 30, 2022.
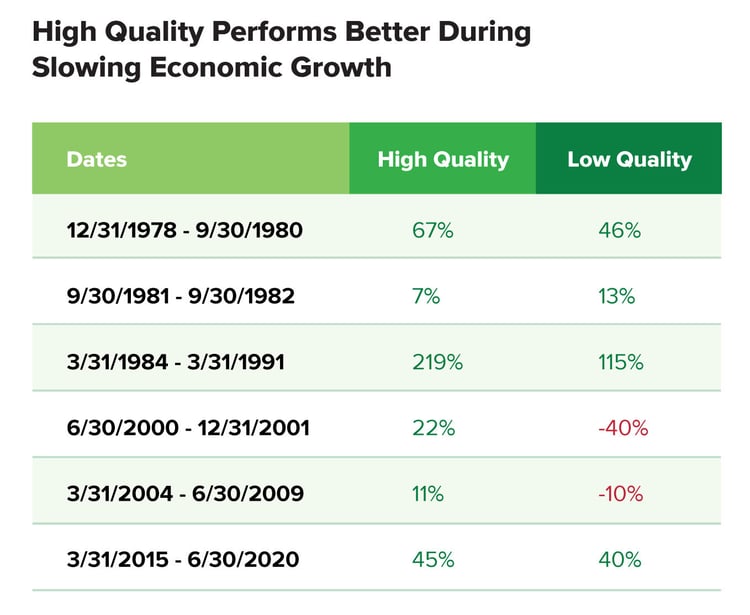
While there appears to be a cyclicality to value vs. growth—in which opposite market environments typically favor one or the other—historically, quality seems to us to be the steady eddy through it all. Performance results discussed in the charts above and below represent past performance, which does not guarantee future results. Yet, in past stressful periods—when growth was slowing and earnings were falling—high-quality tended to generally do better than low-quality.
 Source: mba.tuck.dartmouth.edu
With that said, sometimes factors fail together. The tech bubble is an example. According to recently published research, "In the tech bubble of the period 1998-2000, almost all factors failed across the three regions [of value, growth, and quality]. The performance of factors eventually came back as the tech bubble burst."1
Last year, growth and quality, but not value, failed. So now investors wonder if they will "come back," perhaps, with a vengeance.
Are growth and quality destined for a faster and more robust recovery?
If you adhere to the statistical theory of reversion to the mean, it stands to reason that there is the potential that outperformers may move lower and underperformers may move higher unless there's a fundamental reason why one stays down or up. The iffy question is when. Specific to this discussion, investors are curious if quality, growth, or both will outperform this year.
To answer, we looked at how growth and quality historically performed during and following past recessions with significant market declines.
.jpg?width=750&height=495&name=Quality-and-Growth-Recover-Losses-Faster%20(1).jpg)
Source: CapitalIQ, calculations by Motley Fool Wealth Management. Data from MSCI factor indices through Sep. 30, 2022. The S&P 500 represents the broad market; the MSCI USA Growth Index represents Growth; the MSCI USA Sector Neutral Quality Index represents Quality. 1-Yr. After and 3-Yrs After refers to the period after a recession ended based on FRED data.
The data show that in most cases since 2001, quality stocks (as defined by the MSCI USA Sector Neutral Quality Index) historically outperformed in the year following a recession and continued to beat the market even three years later. Growth stocks (as defined by the MSCI USA Growth Index) were similarly better than the market in most 1-year and 3-year periods after a recession from 2001 to 2020.
But that's not all. Because, according to the data in the chart above, during the period of 2001 to 2020, quality and growth stocks tended to do better after a recession, so we conclude that investors in those stocks, on average, were more likely to recoup their losses faster. For example, in the Global Financial Crisis (2007-2009), the S&P 500 (overall market) fell 28%, 11% more than the MSCI USA Quality Index and 6% more than the MSCI USA Growth Index. Moreover, it took the S&P 500 40 months to recoup those losses. In contrast, it only took the quality index roughly 24 months and the growth index 25 months.
Will it be the same this time?
Unfortunately, no one can answer that question. Past performance is never a guarantee of future performance. But we took a stab at finding recent evidence of market behavior. In the summer of 2022, U.S. stocks showed signs of recovery after falling over 20% in the first half of the year.
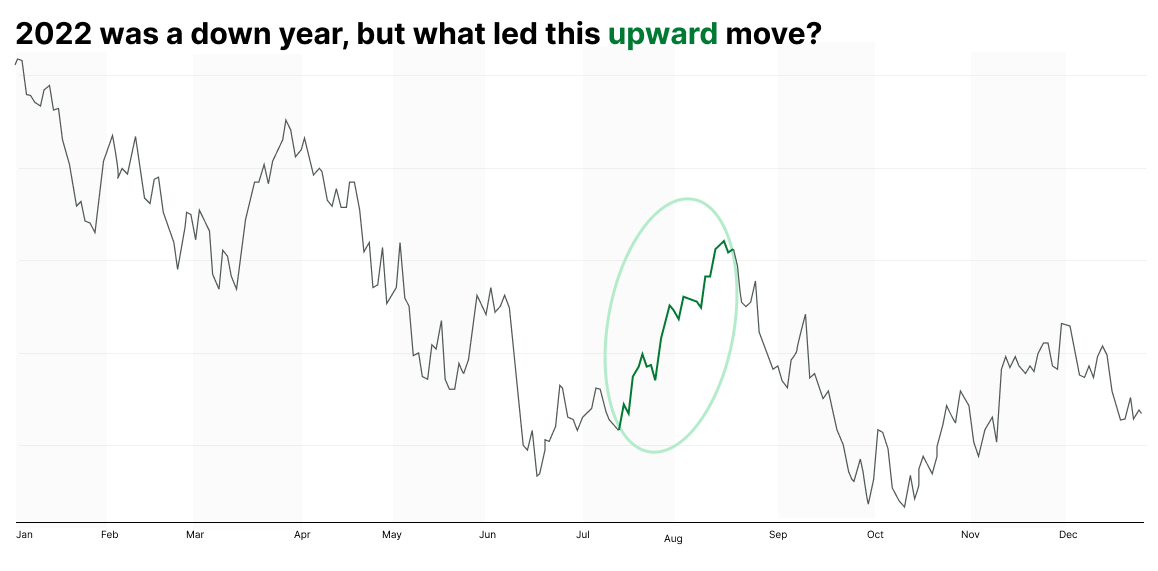 Source: Yahoo!Finance. Data is from Jan. 3, 2022, through Dec. 30, 2022. The highlighted dates are from July 18, 2022, through Aug. 16, 2022.
From July 18 through Aug. 16, 2022, the S&P 500 rose 10.8%. In concert, quality increased by 12.5% and growth by 15.4%.
Obviously, this is a very short period, and viewing it through the lens of long-term investing, it's meaningless, especially for long-term investors who do not try to capture short-term "pops." But in our opinion, this short-term evidence, along with the history of quality and growth following deep recessionary drawdowns and the statistical theory of reversion to the mean, all suggest to us that growth and quality could potentially be relatively strong performers coming out of this downturn.
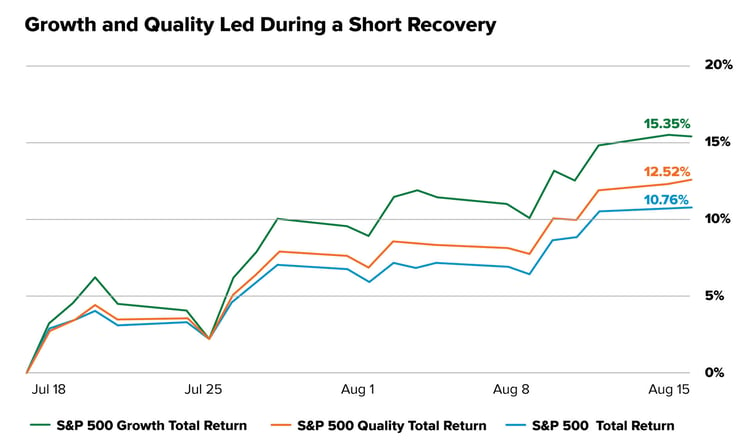 Source: YCharts. Data pulled from the highlighted chart above to show the performance of the broader U.S. market (S&P 500), growth (S&P 500 Growth Total Return Index) and quality (S&P 500 Quality Total Return Index) from July 18, 2022, through Aug. 16, 2022. The sole reason for highlighting this period is to show what happened when the market turned higher for a prolonged period in 2022. Past performance is not indicative of future results.
Do quality and growth outperform in up and down markets?
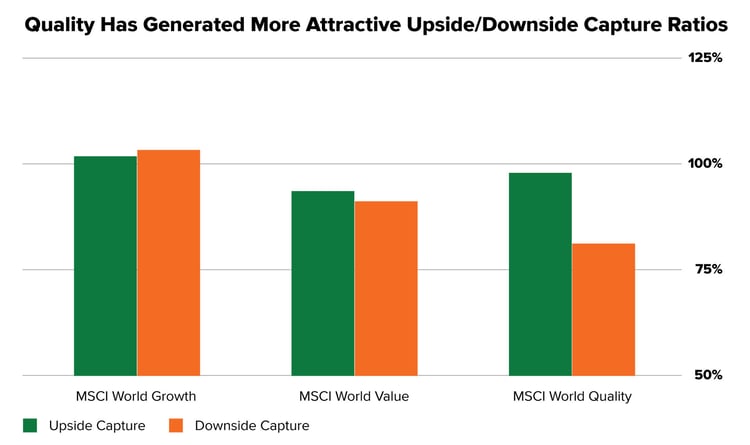
While we're all hoping for an up market, there's no guarantee. So if the market heads lower, how do investors know if quality or growth makes sense? We looked at upside and downside capture ratios to answer this question. (We were also curious about these ratios for value investing!)
 Source: As of May 31, 2022. All data in USD. Indices are net total return. Source: FactSet
This chart shows that growth and quality had robust upside capture—which means they performed as well as or better in a rising market. But, perhaps more important to us in this uncertain environment is downside capture—which shows that they performed as well as or better in a falling market. Growth performed worse than the overall market during a downturn, but quality outperformed. In other words, with a downside capture ratio of roughly 80%, quality stocks declined 20% less than the broader market. (Value is interesting because it underperformed the market during up markets but did better on the downside—the opposite of growth!)
Putting it into practice
If you've followed Motley Fool Wealth Management, you've probably read about our Four Pillars of Quality framework for investing. We feel strongly about investing in quality companies because we believe that when a business has market-leading products and services with unparalleled customer loyalty, a high-caliber management team that has a history of successful executions, a robust balance sheet, and the ability to grow earnings consistently, then the business can potentially weather mini-storms and produce long-term solid results.
We believe the long-term performance chart we showed earlier and these companies' abilities to do well in both up and down markets, support this tenet. And even though research shows that quality stocks get hard hit sometimes, as they did in 2022, these stocks historically come back swingin'.2
The returns of several Motley Fool Wealth Management portfolios strongly correlate with the returns of the MSCI USA Growth and MSCI USA Quality indices. In other words, their return profiles look similar.
Interested in learning more? We'd love to talk with you.
And stay tuned for the next installment in our 2023 Recession series: Investing in Mid-Cap Stocks During Turbulent Times.
Related Articles

How Does the Unionization Trend Impact Your Investments?
“[L]aymen and economists alike tend, in my view, to exaggerate greatly the extent to which labor...

Are the Latest Investment Trends Changing the Rules of Investing?
Meme stocks. Non-fungible tokens (NFTs). Robinhood. It seems that there's a new way to invest or an...

Value? Growth? How About Quality
Difficult market environments often cause investors to rethink their investment strategy....