
Are you ready to take the bull by the horns, so to speak!
You've been putting money aside and are now set to start investing.
Now comes the decision: Where should you put your money? In a passive fund—like an index mutual fund? Or perhaps in an active separately managed account?
Well, if you've seen the data showing that passive managers have done better during the prolonged bull run that began after the 2008 Global Financial Crisis, then the answer seems cut and dry.
But before you make the decision, we think there are two important questions you should ask:
- How can investing in a pooled vehicle—like a mutual fund or an ETF—affect your returns?
- Why does passive management seem to have better returns than active?
The answers to these may surprise you and cause you to rethink your choices.
Question 1: How can pooled vehicles affect returns?
Investors are lumped together with other investors in pooled funds (like mutual funds). For example, when you buy shares of a mutual fund, you’re just a small fish in a much larger pond. You have no say in how the fund is managed, which securities are bought or sold, or even when you receive income from the fund. You only have control over when you buy or sell your fund shares.
But something that is not always well known is that you can be affected when other fundholders buy or sell their shares too. Research shows that the behavior of some investors could reduce the returns of other investors in pooled vehicles to the tune of 0.61% to 1.38% per year.1
Let’s put this in perspective: If you were to lose 1% each year on a $100,000 portfolio, you're potentially starting $1,000 in the hole just because other fundholders bought or sold at inopportune times. So while 1% may not seem like a lot, it can add up over time.
What’s an alternative? Directly partnering with a money manager in an individual or separate account. Separately managed accounts (SMAs) are investment portfolios privately managed by professional managers. They differ from mutual funds because multiple investors do not benefit from the investments. Instead, separate account managers can offer targeted or more personalized strategies for just a single person. And SMA holders are not subjected to other investors' whims and misguided timing. That's because SMA holders are the only investor!
Research2 has shown that in many cases actively managed separate accounts have outperformed index mutual funds by an average of 0.41% per year. But not all SMAs performed better. On average, many underperform. But those with high active share and strong past performance outperformed by 1.38% per year according to the same study 2
Ok, let’s recap.
- Investor behavior could potentially cause other fundholders to lose 0.61% to 1.38% per year
- Certain types of separately managed accounts have outperformed passive mutual funds by an average of 41 bps per year, but not all SMAs…
- Only those SMAs with high active share and strong past performance did better by 1.38% per year
And that brings us to our second question.
Question 2: Why has passive appeared to outperform active?
Passive investing, which tracks a specific index, is designed to match, but not beat, the market performance. On the other hand, active investing has the potential to outperform the market. But herein lies the issue with the data that show passive outperforming active: Not all active management is genuinely active.
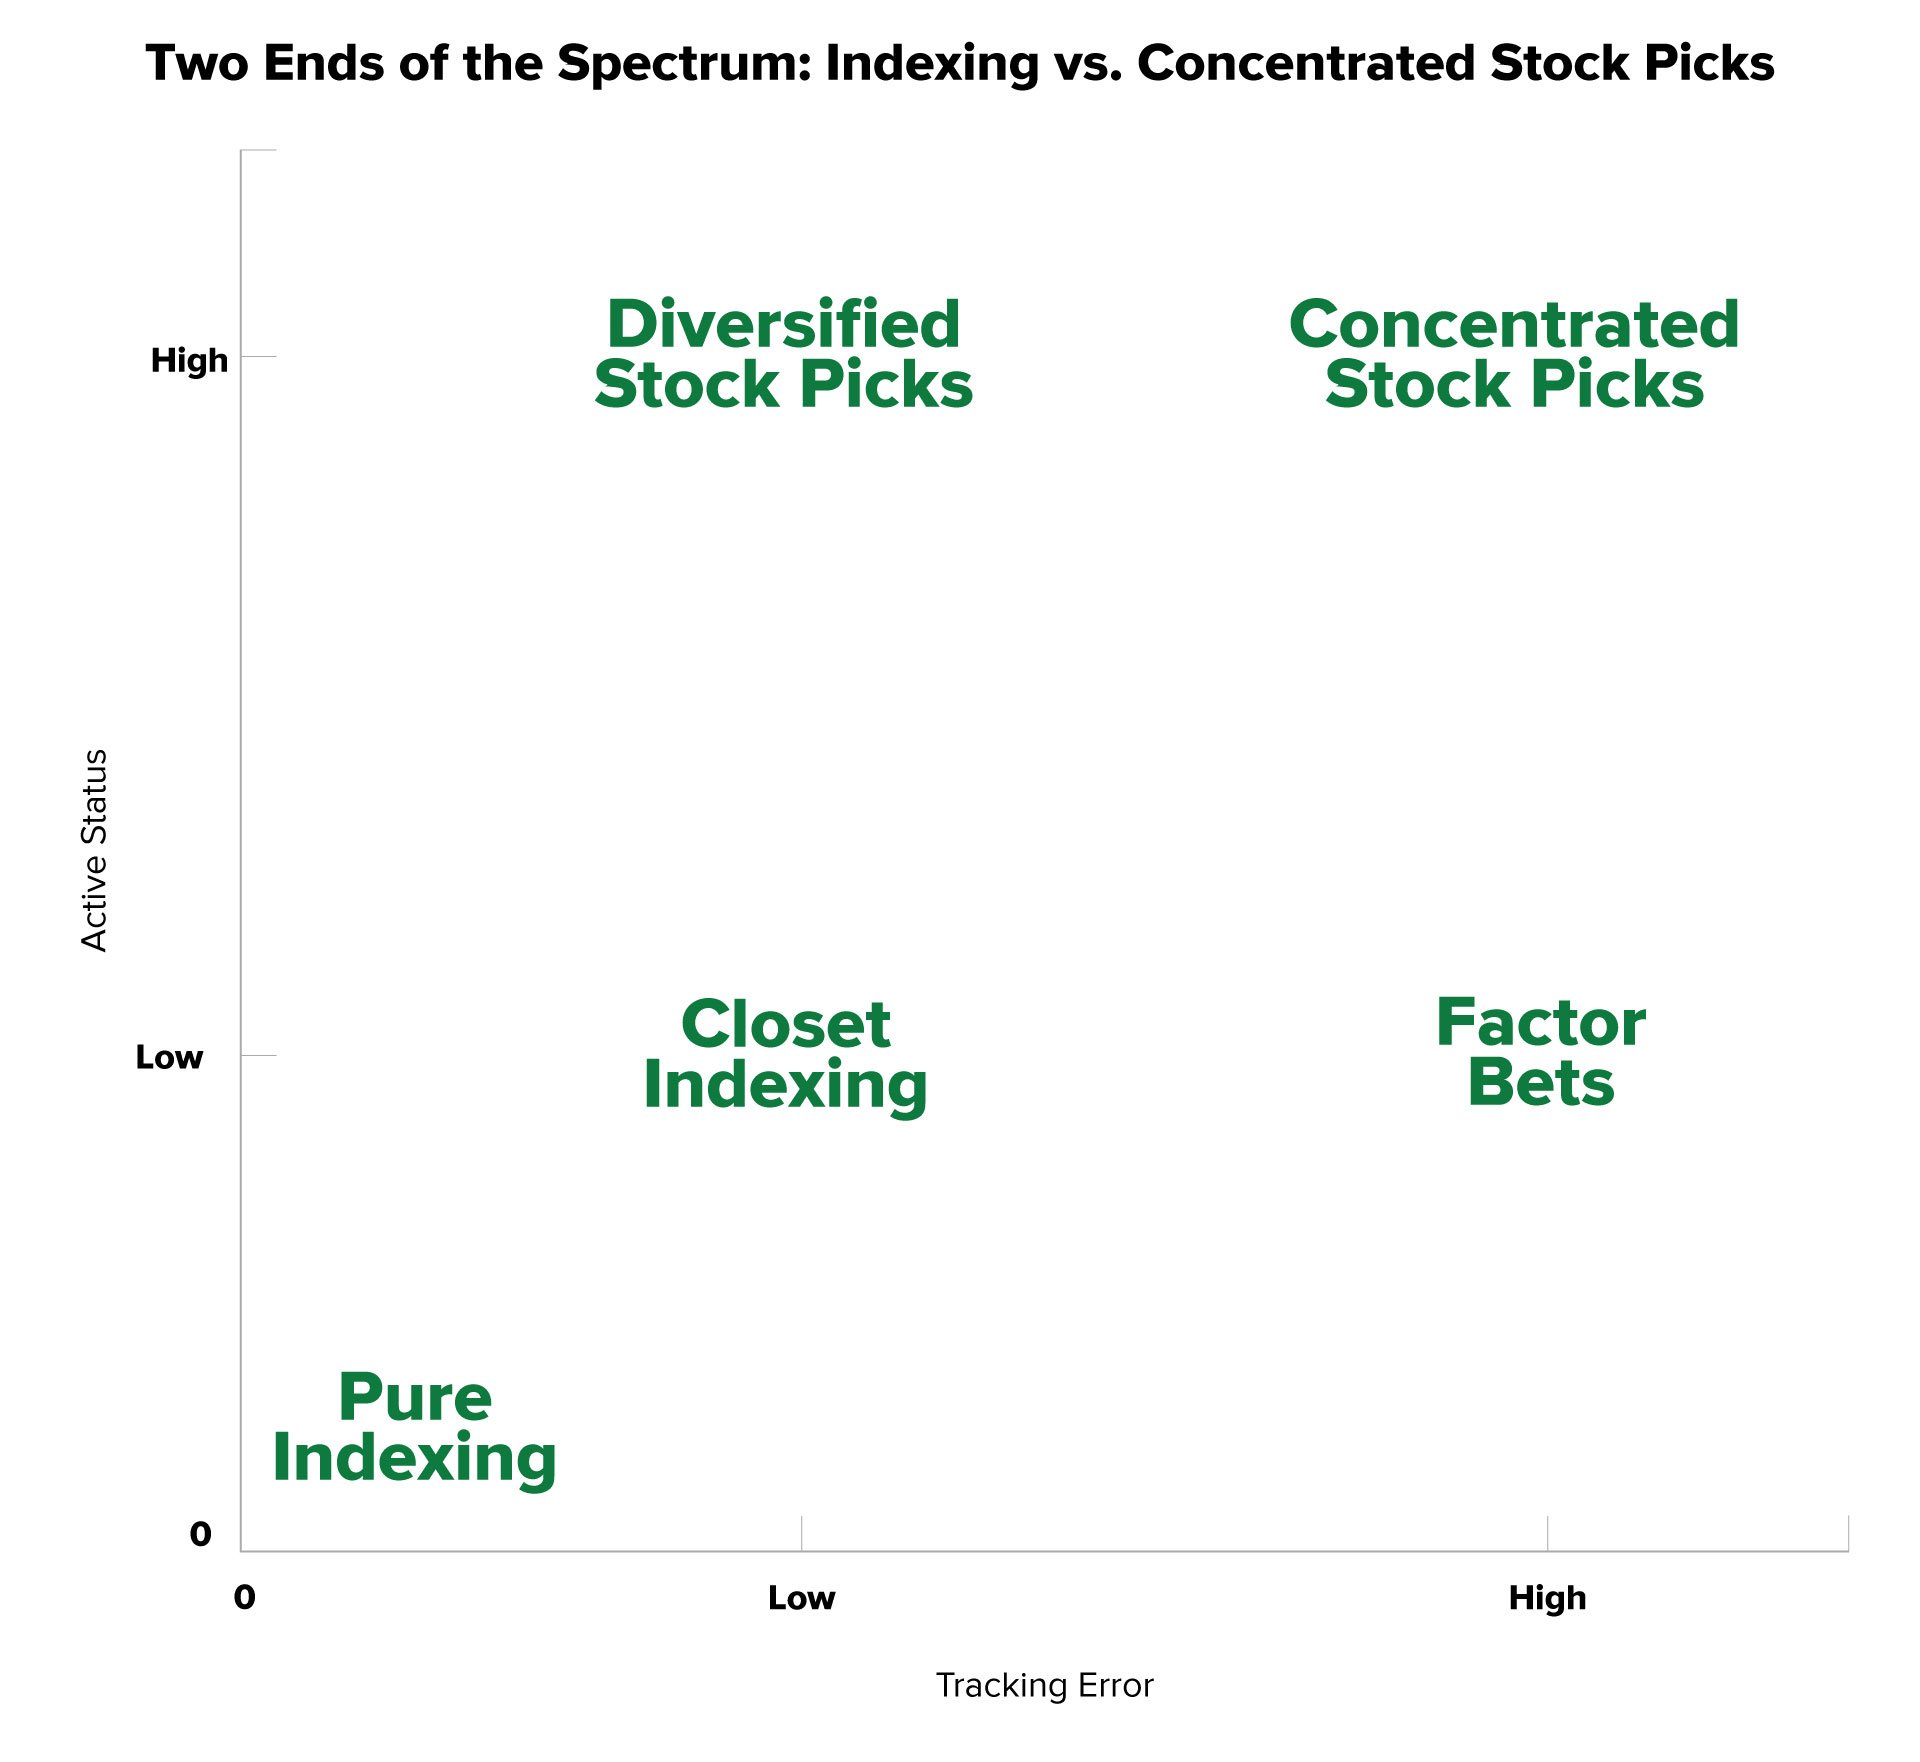
Source: How Active is Your Fund Manager? A New Measure That Predicts Performance, Mar. 21, 2006, Updated Feb. 9, 2019
This chart shows that some managers are "closet indexers," meaning they track closely to the index and don't take positions that differ (even though clients are paying active management fees). Concentrated portfolios with high active share and high tracking error are at the other end of the spectrum.
What is active share?
The measure of active share was developed in 2006 by Yale professors Martijn Cremers and Antti Petajisto to define active management. It assesses how much a manager actively manages a fund by measuring the percentage of investment holdings in a portfolio that differ from the benchmark index. (Tracking error is similar, but instead of measuring holdings variance, it looks at the volatility of a portfolio’s return relative to a benchmark’s return.)
Active management has an active share of 60% or higher. In contrast, an active share of 20% to 60% indicates closet indexing, and less than 20% is passive management3 So when the data show passive outperforming active, you should ask: Are the active funds defined by active share? Not likely.
The concept of active share can be hard to grasp, but think of it like this:
You need a new pair of pants. All your friends purchased the same blue pants, so you’re considering buying them too. But after trying them on, you feel they lack some characteristics that make up a quality pair of pants. So instead, you try on a different pair. These pants fit you well—the length is just long enough, the material is soft and comfortable, and the waist, hips, and inseam are almost tailor-made for you. What do you do? Of course, you buy several pairs in various colors. While you still have other pants in your closet, these new pairs make up a high percentage of your pants wardrobe. Should you care whether your friends buy these pants too? Probably not.
That’s what active share is. Your portfolio managers find a company that they believe has customer loyalty, increasing market share in a growing industry, and is led by a knowledgeable and consistent management team. They have high conviction in this stock, so they buy a sizable portion. Should they care if this stock isn't in the index or that they own a lot more of it? No, they shouldn’t. Because as a client, you’re paying your managers to find perceived gems and put a stake in the ground. Not a twig, but a steel rod stake!
Now to perhaps the most crucial question: Does active share have any bearing on performance?
It does, according to Cremers and Petajisto's research. They found that high active share portfolios outperformed by 1.13% to 1.15% per year over 10 years (1992–2003). Importantly, this outperformance is after fees and transaction costs. In contrast, funds with the lowest active share underperformed by -1.42% to -1.83% per year over that same period. Additionally, recent research (that we cited earlier) corroborates these findings. That study looked at performance from July 2007–December 2019 and found SMAs with high active share and strong past performance outperformed by 1.38% per year.2
And another timely question: How does high active share hold up during a recession? Petajisto updated the study in 2010 to capture the significant market decline in 2008. He found that from 2008 to 2009, the results were consistent with historical findings. During those two years, funds with high active share outperformed their benchmark by almost 1% annualized net of fees, while all other funds underperformed their respective indices.4
Ok, let’s summarize what we’ve learned.
- First, not all claims of active management are truly active. The most “active” are concentrated stock portfolios that exhibit both active share greater than 60% and high tracking error to a benchmark. Yet, the fees charged by active managers—regardless of if they are indeed "active”—may not be all that different.
- Second, a high active share of greater than 60% has the potential to produce better long-term results than lower active share portfolios.
- Finally, the key is long-term performance.
Long term is key
High active share, especially in concentrated portfolios, could also mean that these portfolios could underperform in the short term, possibly significantly. That’s because a high active share portfolio, particularly one with security concentration, may get hit with idiosyncratic risks—risks specifically arising from an individual company.
In the short term, a company's performance can vary due to its business, new investments, growth objectives that may take time to play out, and other factors. Therefore, returns or a concentrated portfolio can be significantly affected when the market turns away from these stocks. We expect this in the short term from time to time.
But over the long term, high-conviction, high active share portfolios could outperform.
High active share alone is not enough
Not everyone believes in active share. Some studies even refute the significance that these studies show. But what many believe, and some data has shown that “active share is most useful not as a stand-alone measure but in conjunction with other variables capturing managerial skill, conviction, and opportunity.”2
So, we look at high active share in two ways: First, as an indication of actual active management, and second, as a representation of a high level of conviction. If a manager has a firm belief, they would be less concerned with how their portfolio matches up to the benchmark. In contrast, a manager with less conviction may introduce benchmark holdings to compensate for uncertainty, leading to a more index-like portfolio.
But high active share by itself can’t guarantee future performance. Neither can only looking at the past performance of a fund or separate account. Instead, we believe, high active share in conjunction with other factors such as market opportunity (finding strong companies at undervalued prices) or superior security selection (picking the right stocks) is more likely to lead to outperformance over the long term.
Related Articles

In Active vs. Passive, the Economy May Deliver the Knockout Punch
The S&P 500 fell over 19% in 2022. Unfortunately, those investors tied to the S&P 500's performance...

Recession: A Stock Picker’s Paradise?
Some people compare investing to the game of darts. During strong up markets, it can appear easier...

Separately Managed Accounts: Designed Just for You
Americans love the feeling of exclusivity. E-commerce giant ETSY* understands that all too well and...