A recession is loosely defined as a decline in economic activity and employment. There isn’t one “official” definition of a recession, but it is most frequently defined as two consecutive quarters of declining GDP.
However, this is just one indicator that can be used to determine whether the economy is in recession. The National Bureau of Economic Research, or NBER, the agency that officially declares a recession, defines it as “a significant decline in economic activity that is spread across the economy and lasts more than a few months.”1
In addition to GDP figures, the NBER also looks at unemployment, consumer spending, income, and industrial production. There are no fixed thresholds for any of this. A recession has to do with the big picture — not just a specific combination of variables. For example, a period of mild GDP decline accompanied by strong employment growth might not be considered a recession.
Plus, keep in mind that economic data is typically reported some time after the reporting period. So, it’s impossible to say for sure if we’re in a recession until well after it has actually started. And the same can be said for the end of a recession.
But what has historically happened to the stock market in recessions? And how long will the tough times last? Let’s take a closer look at what history tells us, and what it means to investors like you.
How long could a recession last?
The short answer is that nobody can predict with any degree of accuracy when a recession is going to begin, or how long it will last. The current situation is a perfect example – when inflation soared to generational highs in mid-2022, and the Federal Reserve was rapidly raising interest rates to get it under control, most experts predicted we’d be in a recession by now.
Since 1948, we’ve had a total of 11 recessions, and the average recession has lasted for 10 months.2 During these recessions, the average GDP growth has been negative 2.5% at the depths of the recession, and the job market has contracted by an average of 3.9%.
However, these are just averages. These recessions have been as long as 18 months or as short as just two months in the case of the early 2020 COVID-19 recession. Some have been rather mild, like the early 2000s recession that followed the dot-com bust and saw a peak decline of just 0.3% in GDP. Others have been rather harsh, like the Great Recession that was triggered by the 2007-2008 subprime mortgage crisis, which caused unemployment to rise into the double digits before things started to cool down.
How has the stock market performed during the last few recessions?
Recessions are generally thought of as being terrible for the stock market. After all, during recessions, corporate earnings tend to decline (at least temporarily). But let’s take a closer look. Consider the last few recessions:
| Recession | Time Period |
|---|---|
| COVID-19 Recession | Feb. 2020 – Apr. 2020 |
| Great Recession | Dec. 2007 – June 2009 |
| Early 2000s Recession | Mar. 2001 – Nov. 2001 |
| Early 1990s recession | July 1990 – Mar. 1991 |
| Early 1980s Recession | July 1981 – Nov. 1982 |
| 1980 Recession | Jan. 1980 – July 1980 |
Here’s a bit about the circumstances that surrounded each of these recessions, and how the stock market performed.
- The COVID-19 recession was a historically unique situation — and not just because it was caused by a global pandemic. It was unique in that it was an intentional recession, caused by lockdown orders and other pandemic restrictions. While economic growth declined sharply, it returned just a couple months later. Stock market performance was poor during the two-month recession in 2020, with the S&P 500 delivering a negative 23% total return.3
- Prior to the COVID-19 recession, the stock market enjoyed the longest bull market in history at 10 years and eight months in length. And this was preceded by the Great Recession, caused by the fallout of the Global Financial Crisis. That recession officially lasted for 18 months, from Dec. 2007 until June 2009.4 During this recession, the S&P 500 total return was a dismal negative 34%.
- The early 2000s recession stemmed from the combination of the dot-com bubble bursting and the economic effects of the September 11 terrorist attacks. During this recession, the market declined by 12%.
- The early 1990s recession resulted from a combination of a Federal Reserve rate hike cycle and spiking oil prices, as well as the Gulf War. However, during that eight-month recession, the S&P 500 returned a positive 6%.
- The early 1980s recession was caused by rapid inflation, rising rates, and lingering effects of the 1979 energy crisis. However, the stock market produced positive returns, with a modest 1.8% gain. This was preceded by a shorter recession with many of the same causes, and this six-month recession resulted in a total positive return of 5.8% for the S&P 500.3
There is no set rule of thumb when it comes to stock market performance in recessions. If anything, history has shown that recessions that are caused by inflation or a Federal Reserve rate hike cycle (like the one most economists expect within the next year or so) can surprisingly produce positive stock market returns. Virtually nobody is predicting a recession anywhere near as deep as the Great Recession, and as mentioned, the COVID-19 recession wasn’t directly caused by economic forces.
One virtual certainty in recessions
While there’s no clear pattern of whether stocks go up or down in recessions, one thing is much more certain — the stock market tends to be far more volatile.
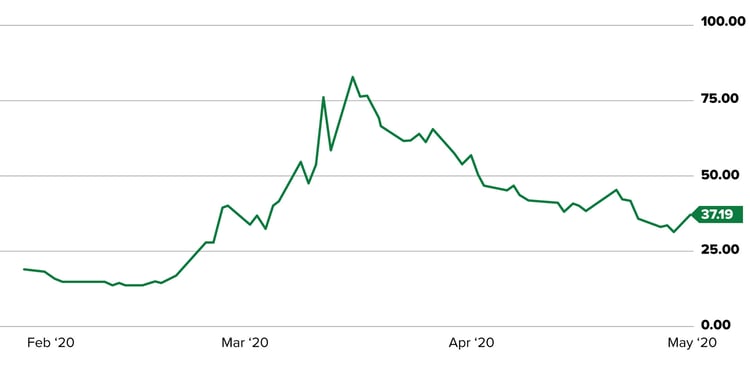
Consider the CBOE S&P 500 Volatility Index, which is more commonly referred to as the “VIX volatility index,” and is widely considered the best gauge of volatility and uncertainty (investor fear) in the stock market.
Knowing the mathematics behind the index isn’t necessarily important. But the long-term average of the VIX is between 20 and 22. In calmer market environments, it regularly dips into the teens (it’s about 14.3 as we’re writing this).5 But it can spike higher during recessions.
During the COVID-19 recession, the VIX spiked as high as 80 – its highest level since the index was formed more than 30 years ago.
CBOE S&P 500 Volatility Index (*VIX) Level
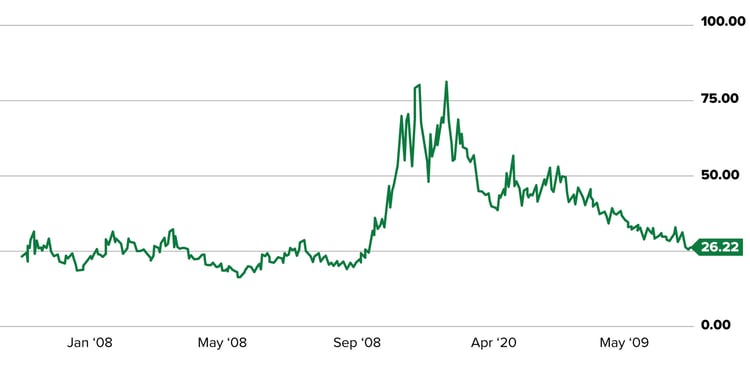
In the Great Recession, the VIX initially hovered slightly above long-term averages, but soared above 75 as banks began to fail and our financial system was on the brink of collapse.
CBOE S&P 500 Volatility Index (*VIX) Level
And finally, in the early 2000s recession, the VIX spiked well above its long-term average both initially due to the dot-com fallout, and again in the wake of the September 11 attacks.
CBOE S&P 500 Volatility Index (*VIX) Level
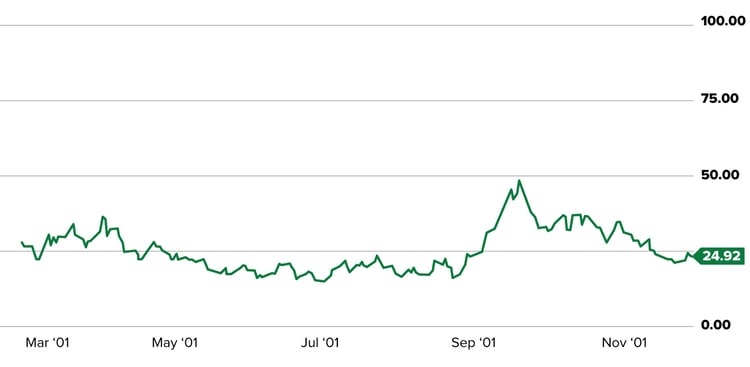
Our takeaway is that while we can’t predict the direction of stocks in a recession, we think it’s wise to expect to be taken on quite a roller coaster ride while it’s happening.
What does it mean to investors?
While this might sound odd, the key takeaway is that when a recession is looming on the horizon, the best thing you can do is to expect uncertainty. All investing involves risk and may lose money (including principal). The stock market won’t necessarily plunge, as plenty of historical data will tell you. So, in our opinion, selling your stocks and waiting on the sidelines isn’t a great strategy.
Plus, you could risk missing out on major gains if a recession doesn’t come. Consider this: Heading into 2016, economists at Citi Research predicted the U.S. would enter a recession with 65% probability, nearly seven years since the Great Recession ended.6
Well, it never happened. From the start of 2016 through the end of 2019, the S&P 500 produced a stellar total return of 71%. Imagine if you had sold all of your stocks because “a recession is coming.”
The bottom line is that nobody knows if and when a recession will arrive. They don’t know how bad it will be if it does arrive, or how long it will last. And they certainly don’t know how the stock market will perform. In many cases, anticipation of a recession can have a worse effect on the market than a recession itself. We believe staying the course and investing no matter what is the better path to long-term wealth. Don't let recession forecasts derail your progress!
Related tags
Financial Planning Investing Stocks Markets & the Economy Financial Education Financial Literacy
Like what you're reading?
Join the thousands of readers getting stories like this delivered straight to their inbox every Thursday — for free. Give it a spin, enter your email to sign up.
Footnotes
2The Balance, "History of Recessions in the United States," Oct. 19, 2022.
3123Jump Financial Markets, "S&P 500 Monthly Return (1928-2021)", Accessed 11/16/2023.
5CNBC, CBOE Volatility Index, Accessed 11/16/2023.
6CBS News, "Will the U.S. Economy Slip Into Recession in 2016?", Updated April 27, 2021.
Related Articles
5 Money Tips For 2023 And Beyond
You might be surprised at how few New Year's resolutions are actually achieved (or maybe you know...

Are We in a Recession?
Many people fear a recession. And for good reason! A recession generally means the economy is...

What Can You Take Away From the Consumer Confidence Index (CCI)?
You’ve probably heard mention of the Consumer Confidence Index on the news, alongside other...
