
What happens when a doctor recommends that you eat healthier? The reaction varies by individual. Some people may go all in, while others may push the advice to the wayside. Sometimes the response depends on the degree of change needed: Is it as simple as eating more vegetables or as complex as having a no-salt/no-sugar diet?
For instance, instead of following the recommended diet, some people might prefer enjoying their food now and worrying about their long-term health when they're older or a problem arises. At the same time, others may go to the extreme, eating only green foods!
But what if they can eat both—foods they enjoy and healthy options too? Maybe then, they could take pleasure in the here and now and not worry about the later.
Investing in a market in turmoil ranks alongside that healthy eating recommendation for some people. They face a similar dilemma: Should they stay on the sidelines and enjoy less stress but potentially sacrifice long-term wealth creation? Or should they plug their nose and take that healthy route by investing all in right now? Perhaps there's that middle ground of eating healthy and enjoying some of what they like—by investing slowly over time.
What is dollar-cost averaging?
This slow and steady approach is known as dollar-cost averaging (DCA). Dollar-cost averaging allows investors to invest at regular intervals, no matter whether the market is going up, down, or sideways. The benefits are twofold:
- In a falling market, you buy shares at lower prices, so your average cost is lower than in a rising market
- In a rising market, you buy shares at higher prices, so your average cost is higher than in a falling market
Let's illustrate two ways this approach can impact your wealth.
Illustration: Investing vs. saving
Let’s take the last five-year period in the U.S. stock market. That period started with a down market (2018) and included a global pandemic that caused both a massive drop (2020) and a steep rise (part of 2020 through 2021), followed a year later by another double-digit decline (2022)—a volatile period to say the least.
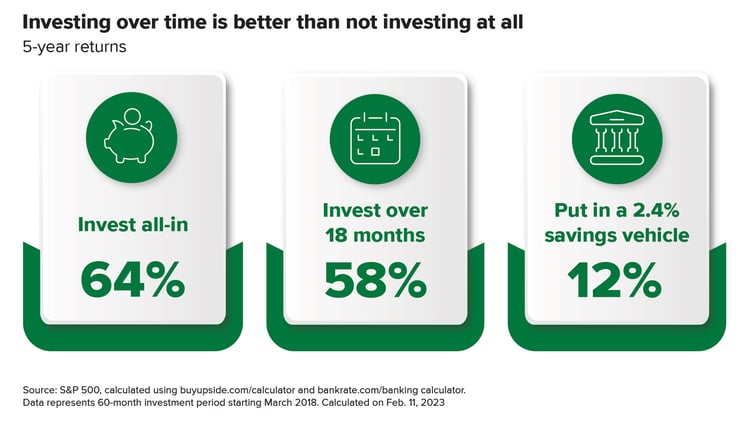
If Sasha (our hypothetical investor) had invested her total savings of $560K in a fund that followed the S&P 500 on March 1, 2018, five years later (2023), she would have had $917K—an increase of 64%.1
However, she was fearful since the market was declining when she started investing. So she decided to add a little at a time to her portfolio by investing the $560K over 18 months in monthly increments of about $31K. By staggering her investment dollars over a year-and-a-half, at the end of the five years, her portfolio grew to $883K. This growth was slightly less than if she had invested it all at the beginning, an all-in approach—58% vs. 64%.1 But she was ok having lower growth for the peace of mind it afforded her.
She also considered bypassing the stock market entirely and taking advantage of a high-interest savings account that was expected to pay an average annual yield of 2.4% (significantly higher than what the average savings account paid over the last 15 years of less than 1%!).2 She liked the safety of knowing her money was in a bank. Had she opted for that choice, Sasha would have had $627K in five years—a growth rate of 12%.3
 This hypothetical example highlights several ways to invest—go all-in, invest at a regular cadence over a specified time frame, or accrue interest in a savings vehicle.
We chose these five years because they featured many fluctuations and significant down periods. Yet despite those declines, in this example, the all-in approach still came out on top.
However, you may think you're exceptionally gifted at choosing the best investment time. So let's look at a different illustration.
Illustration: Timing the market
Edwin believes he has a good feel for the market and can jump in when it goes up and out when it goes down. He's confident this is a better approach to growing his long-term wealth, even if he doesn’t invest precisely at the bottom or pull out at the tippy top. Let’s assess Edwin's approach.
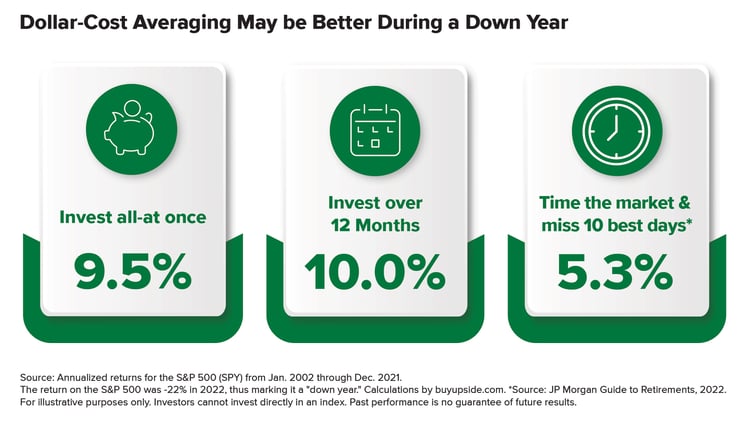
We considered Edwin’s approach over 20 years, from Jan. 2002 through Dec. 2021. During these years, in addition to experiencing Sasha's market events, Edwin would also have invested through the tech bubble (2002), the Global Financial Crisis (GFC) (2007-2009), and a decade-long bull market that ended at the end of 2021. (We chose 2002 as the starting point since the market was down 22% that year.)
In this case, if Edwin had utilized a dollar-cost averaging strategy over 12 months (from Jan. 2002 through Dec. 2002) and then remained invested from Jan. 2003 through Dec. 2021, he would have been slightly better off over the entire period than investing all at once—achieving an annualized return of 10.0% vs. 9.5%. That's because he had a lower average cost when the market was falling and bought shares on their way down.
But if Edwin stuck to his belief that he could successfully time the market, he would have had about half the wealth compared to the other two strategies.
 There are several reasons for these findings. First, DCA has historically tended to outperform a lump sum strategy in certain prolonged down markets. Examples include the tech bubble and the GCF. But in most other markets, we believe a lump sum approach is generally better.4 That's because the longer money stays invested, the greater the potential to experience compounding growth.
.jpg?width=750&height=422&name=DCA-Outperformes-Lump-Sum%20(1).jpg) Source: econ.yale.edu. Shiller data is from 1960-2018. On average DCA (over 24 months) underperforms a lump sum by 7.5% and in 74.2% of the months within that period.
Source: econ.yale.edu. Shiller data is from 1960-2018. On average DCA (over 24 months) underperforms a lump sum by 7.5% and in 74.2% of the months within that period.
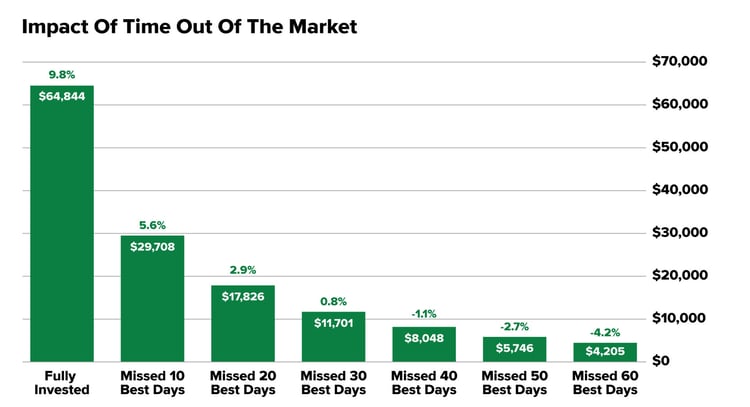
Second, we think timing the market often fails because you'll likely miss the best days. For example, over the same 20 years from 2003 to the end of 2022, six of the seven best days occurred after the worst days, and seven of the best 10 days fell within two weeks of the 10 worst days within that two-decade period.5
 Source: JP Morgan Guide to Retirement, 2022. See footnote 5 for calculations.
Your strategy, your time frame
These illustrations walk through two very different investing time frames—five and 20 years. We specifically chose a shorter and longer period to show that your choice of strategy—all-in, DCA, or market timing—is influenced by your investment horizon. For example, if you only have a 3-year horizon, perhaps the safer choice—a savings account—may be best since there's less time to make up for a potential market loss and market volatility. But if you have a longer horizon, entirely investing may be the better course of action. The key is to understand your risk tolerance and your time frame.
But the data clearly show that, in general, timing the market rarely succeeds. You can get lucky and miss the worst day but capitalize on the best day. However, often you either miss both or hit both! And there's a very high cost of missing the best days for long-term wealth creation.
Related Articles

Will Your Retirement Plan Be Successful? How You Can Gauge the Likelihood
Are you preparing for retirement and expecting to spend a certain amount each month from your...

Should You Have Bonds in Your Investment Portfolio?
88%. That’s the percentage of return that comes from asset allocation for most investors.1 So it’s...

ETF vs. SMA: Which is Right for You?
The financial industry never stops evolving. In the ‘70s, mutual funds boomed. In the ‘90s,...