When the market falls from its high, does it mean it's oversold? What about if it keeps making a new high daily? Is it then overbought?
Looking for signs
Technical analysts—individuals who make decisions based on chart signals, not the fundamentals of a company’s business—often turn to certain indicators that assess oversold or overbought conditions. Here we discuss four common ones:
- Relative strength index It looks at the speed and magnitude of a price change to determine conditions. A reading of 30 or lower can indicate oversold, while 70 or higher is considered overbought.
- Money flow index (MFI) This index uses both price and trading volume data and suggests a reading below 20 is oversold while above 80 is overbought.
- Bollinger bands This indicator consists of a centerline simple moving average and upper and lower bands (determined by standard deviation) that designate price targets. When the price touches the lower band for a few trading sessions, it signals it’s likely oversold (and vice versa for overbought and the upper band).
- Volatility index (VIX) The VIX measures fear in the market. Hitting 40 or higher tends to signal the market has capitulated—a hands-in-the-air surrender—or is near the bottom.
Let’s walk through a chart
Let's look at an example from June 2022, when the S&P 500 was dragging along its lower band while the RSI was nearing oversold conditions. Money flows were still not in oversold territory, although they continued to drop over the next sessions—appearing to lag the other two indicators. And the VIX started retreating, falling below that important 40 mark.
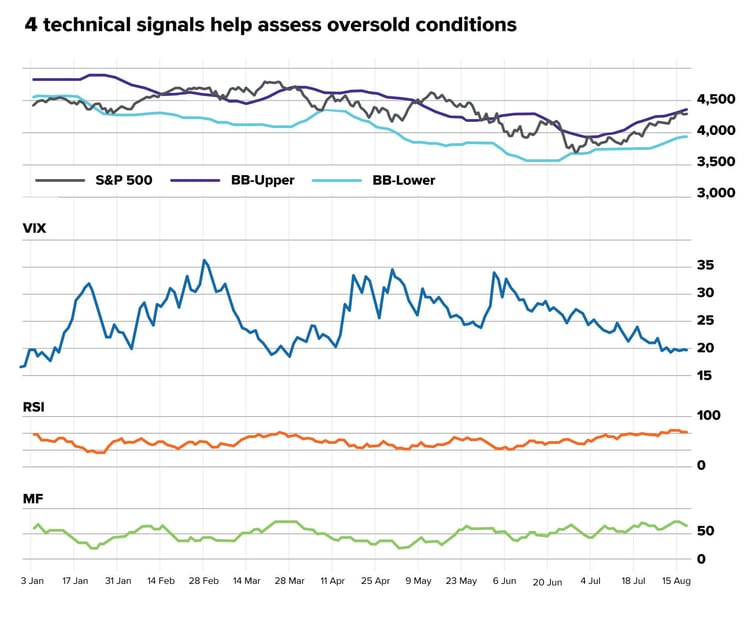 Source: marketwatch.com, data as of Aug. 16, 2022
Market drawdowns are hard to stomach
And while it may be tempting to make buy or sell decisions based on technical indicators like these, we prefer a different approach because we’re in it for the long haul.
Instead, we employ fundamental analysis to pick what we believe to be quality companies that we feel have the potential to perform well over the long term, regardless of short-term market conditions. The reason is simple: These short-term trends, we believe, are less relevant, particularly when you compare them to a chart like this...
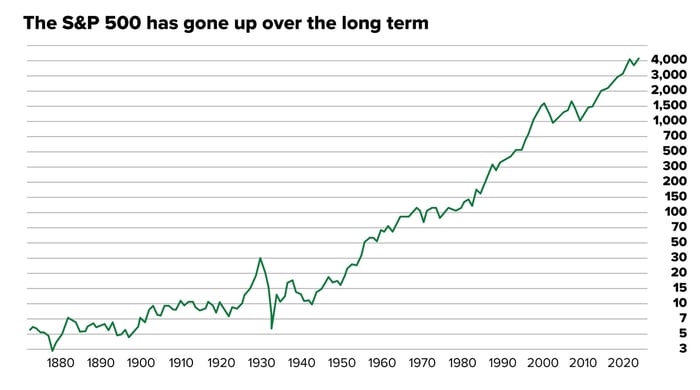
Source: Multpl.com, data as of Aug. 4, 2023
Related Articles

Recession Obsession: How Scared Should Investors Really Be?
Traditionally recessions are characterized by slowing economic growth, job loss, rising...

Could Quality and Growth Investing Lead to Faster Loss Recovery?
When most people shop for a big-ticket item—like a car, tv, or even a vacation—they fall along a...

Is 2023 the Year for International Stocks?
2022 was a bad year for stocks, not just in the United States. The MSCI All Country World Index, a...