
Over the last several months, we’ve talked about two themes that, in part, drove the market higher in 2021—the rise of retail investors and low-quality growth stocks. And now both appear to be contributing to the downshift that started before inflation and rising interest rates became the story.
These two charts show why they may be two significant contributors to the market sell-off.
The first chart shows how the performance of retail investors fell as the S&P500 continued to rise. Notice the cross-over point right around the time of the GameStop phenomenon.
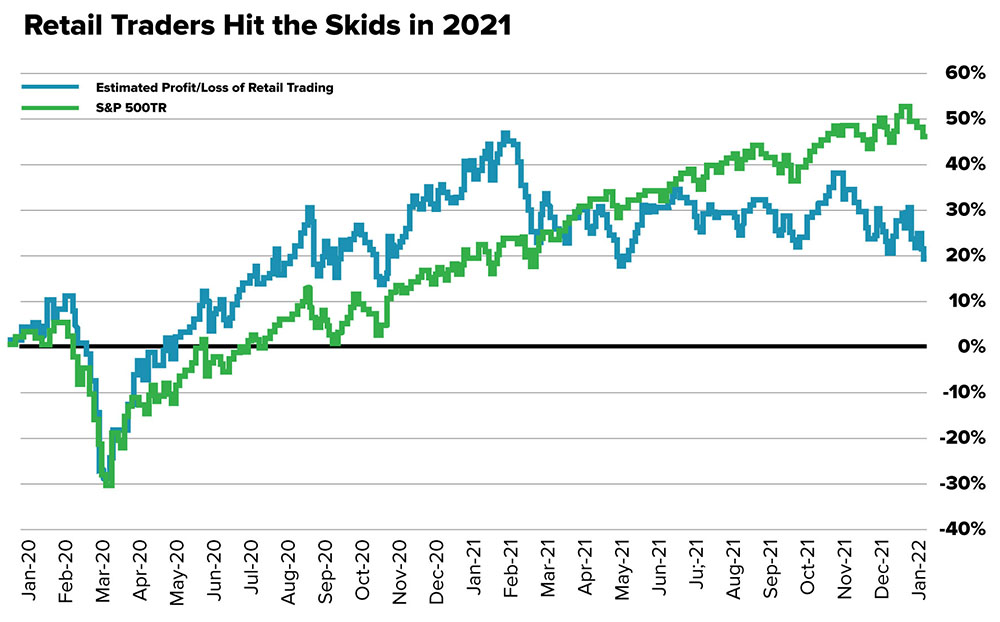
Source: Morgan Stanley QDS, Exchange Data Feeds. Note: All flows estimated from public data.
The second chart illustrates the low-quality nature of the stock market’s return over the last two years. In what seems to be a flashback to the dotcom bubble (see the spike around 2000), these unprofitable companies have soared since the pandemic.
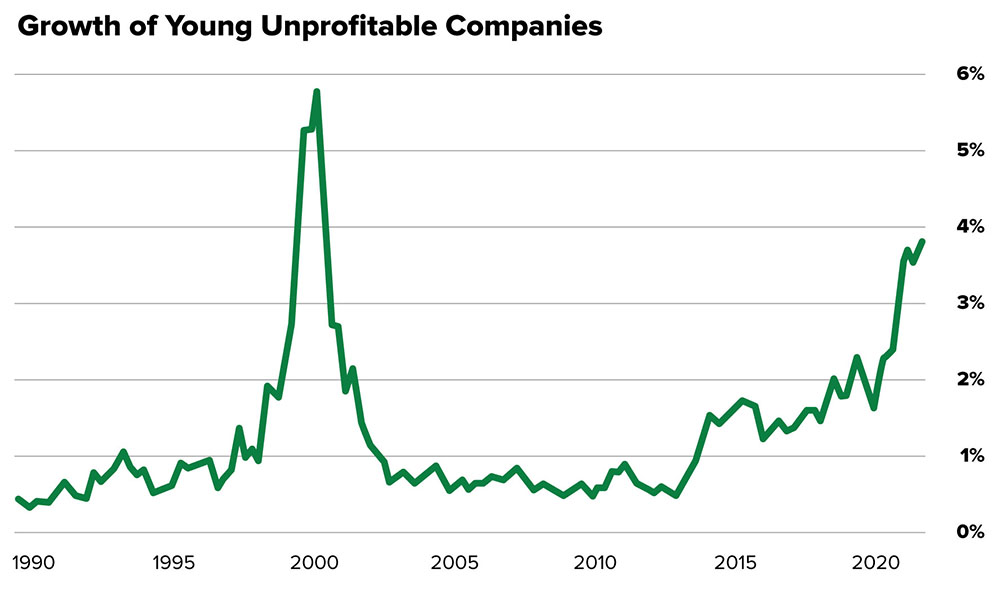
Source: FactSet, J.P. Morgan Asset Management. Q3 2021. Young unprofitable companies are defined as companies with negative net income in two of the last three years, less than five years since IPO, and annual revenues growing less than 15%.
So what could this mean for your portfolio?
Many investors tend to have an anchoring bias, meaning they have a hard time letting go of the stocks that at one point made them money.1 We saw this during the dotcom bubble, where the Nasdaq experienced three rallies of more than 40% from its peak to the bottom.2 So, if history is any guide, the way down this time may be bumpy as well.
But not all is doom and gloom. First, high-quality companies may fall in sympathy with their low-quality brethren, but they often have the potential to come out on the other side and resume their growth trajectory. Second, when markets throw out the good with the bad, patient active investors may have the opportunity to buy high-quality companies at cheap prices. And that’s precisely what we aim to do.
Related Articles

3 U.S. Market Trends That May Help Build Wealth
Did the 2022 market decline sour you to investing in stocks? That’s understandable. Being trigger...

Want to Hedge Inflation?
Worried about inflation and wondering if you should put your money in Treasury Inflation-Protected...

Is 2023 the Year for International Stocks?
2022 was a bad year for stocks, not just in the United States. The MSCI All Country World Index, a...