
Did the 2022 market decline sour you to investing in stocks? That’s understandable. Being trigger shy after experiencing a steep market decline is not uncommon. Even seeing a recent example of a rebound after a sharp decline, like what happened in 2020, may not entice you to put your money into the stock market. You may be like some investors who are scared off for good or others who are waiting for a more opportune time. But we believe any time you can invest is a good time.
Three time-tested trends
If you’ve ever heard the saying, “Gotta be in it to win it”, you understand that you cannot possibly compound your money without being invested. These three trends explain why.
Trend #1: Time in the market is typically more important than timing the market
Waiting for the most optimal time to put money into stocks often impedes wealth accumulation.
Let’s walk through an example:
Janeen has $10K to invest in the stock market but is unsure if now is the right time to buy stocks. Recent volatility has her questioning if she should wait and continue to hold cash instead. Her wealth advisor analyzed returns over the last 20 years to show her the potential impact of her decision.
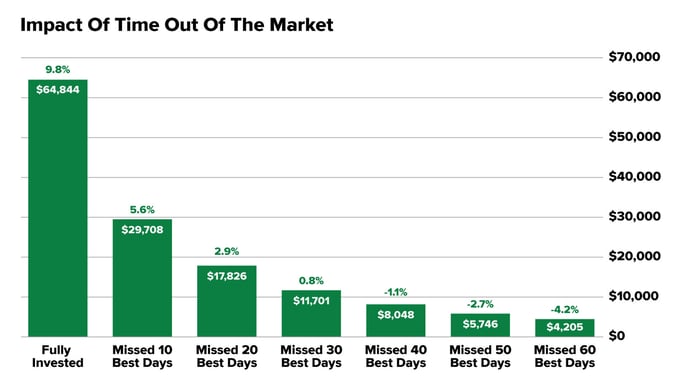 Source: JP Morgan Asset Management. The dollar amount shows the performance of a $10,000 investment between Jan. 1, 2003 and Dec. 31, 2022. Returns are based on the S&P 500 Total Return Index. Indices do not include fees or operating expenses and are not available for investment. The hypothetical performance calculations are shown for illustrative purposes only and are not meant to be representative of actual results while investing over the time periods shown. Calculations are gross of fees but include reinvested dividends. Hypothetical performance do not reflect actual trading, liquidity constraints, fees and other costs and may not account for the impact of certain market factors such as lack of liquidity. Simulated trading programs are designed with the benefit of hindsight. Returns will fluctuate and an investment upon redemption may be worth more or less than its original value. Past performance is not indicative of future results.
The analysis indicated the following for the period examined. If Janeen:
- Invested all days, her wealth would have increased to over $65K
- Missed the 10 best days, her wealth still would grow by $30K, but would be roughly 54% less than investing all days
- Skipped the 40 best days, she would have lost all of her initial investment, plus another 1%
Why is there such a big difference by missing just 40 out of an overall 7,200 days?
Trend #2: U.S. stocks tend to rise over time
Staying on the sidelines for just 40 of the best days out of an overall 7,200 days wouldn’t be harmful if investors had a crystal ball that foretold the very worst market days. But that’s not realistic! Often the best or worst days occur without warning—and within close proximity to each other. Data show that over the last 20 years, from January 1, 2003, to December 31, 2022, six of the seven best days occurred after the worst days, and seven of the best 10 days fell within two weeks of the 10 worst days within that same two-decade period.2 Luckily, investors don’t need to have a high level of prescience.
Despite periodic dips, the U.S. stock market has risen over the long term. Even after prolonged or severe drawdowns due to wars, regional or global pandemics, burst bubbles, and a global financial crisis, the stock market has recovered and continued to grow.
But could the next decline last longer or be too severe to recover from? These worries—despite the long-term growth trend—may paralyze some investors. Truth #3 puts drawdowns into perspective.
Trend #3: Large pullbacks have been relatively short-lived
Since 1942, there have been six drawdowns of 30% or more for U.S. stocks. The shortest drawdown lasted 1.1 months (COVID-19 pandemic), while the longest was 18 months (Tech Bubble).3
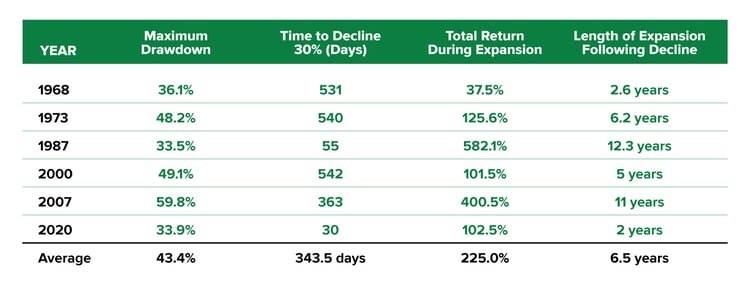 Source; Factset, Morningstar, First Trust, Bloomberg. Data for the S&P 500 Index was measured daily from April. 29, 1942 to March. 31, 2023.
Still, a decline that persists for a year and a half may seem long. But compared to the expansionary periods that followed these drops, it’s pretty short. The average expansion following these episodes was over seven years. And during those periods, the market delivered an average total return of more than 225%.4
Still timid?
Despite these three historical patterns, market drawdowns are disconcerting, and some investors may still fear investing at the wrong time. One way to overcome that concern is to dip your toe into the market slowly by dollar-cost averaging.
In dollar-cost averaging, individuals invest a specific amount at regular intervals over time. Most individuals already do this—through an employer-sponsored retirement plan, like a 401(k). In employer-sponsored plans, a set amount is typically taken out of earnings and invested in each pay period.
Dollar-cost averaging is helpful for investors who have trouble saving or are fearful of going all-in at once. Investors can buy shares at cheaper prices by investing gradually if stock prices fall. Conversely, if prices rise, they are hurt by buying shares at higher prices.
But there are trade-offs. First, as a portion of cash sits idle on the sidelines, it’s not working to potentially build net worth. Second, the longer it takes to invest, the lower the potential wealth accumulation. Data show that two-thirds5 of the time, investing immediately produced better long-term results than a staged entry. But for fearful investors, the “cost” of dollar-cost averaging may well be worth the peace of mind.
Two critical points
Maintaining a high cash position in most environments tends to disadvantage wealth growth. But often, it feels safer, especially for risk-averse individuals. To overcome the hurdles induced by fear or other circumstances, consider two critical points:
First, continue to invest. By removing emotion from the picture and investing on an ongoing basis, you eliminate the illusion of the "right time." We believe that time in the market is one of the key determinants of building wealth over time. But if being fully invested isn’t feasible, a staged entry is better than not investing at all.
Second, lengthen your time horizon. The U.S. stock market tends to rise over time. So even if there is a pullback, historically, it has recovered and continued its upward trajectory. Even in the short term and after a pullback, the market tends to move higher. Since 1957, there have only been two instances of back-to-back negative years.6
That’s why the longer investors stay in the stock market, the lower the risk of losing money and the better the chance of making money. Since 1926, in the short term (one year), investors lost money 26.8% of the time. But over the long term (15 years), investors lost money not even a quarter of a percent (0.25%) of the time.7
Now those are odds even the most fearful can get behind!
Related Articles

Want to Hedge Inflation?
Worried about inflation and wondering if you should put your money in Treasury Inflation-Protected...

What to do With a Sudden Influx of Cash
Are you ready to convert your blood, sweat, and tears into cold, hard cash by selling your...

What Does Inflation Mean for Your Wealth?
Rising prices are scary for many people, especially for those on fixed budgets. But while the...