
Recessions are an economic—not a stock market—phenomenon. Yet, since the economy and the market, while not the same, are intertwined, investing during a contraction may require tweaks to your portfolio. What do we mean by “tweaks”? We generally aren’t implying a wholesale strategy change or a “shoot now, ask questions later” mentality. Instead, investing before, during, and after a recession is about reassessing asset allocation and reevaluating stock positions to take advantage of rare opportunities to set up your wealth for growth when things turn around.
Reassess asset allocation
88% of a portfolio’s return comes from asset allocation —the mix of stocks, bonds, and alternative assets that make up a portfolio.1 Asset allocation is a function of an investor’s goals, time horizon, and risk, among other factors. So how do you determine what could be the “right” allocation?
If we ignore risk as a parameter for asset allocation, the optimal portfolio for most people probably would be a 100% stock portfolio. Because a 100% stock portfolio historically has produced the best long-term returns. For example, from 1926 through 2021,2 the average annualized return of an all-stock allocation was 12.3%. A 100% all-bond portfolio’s return was roughly half of that—6.3%.
But risk is a significant factor in determining asset allocation. Back to our example: The all-stock portfolio’s return is less consistent—it had 25 years of negative returns (out of 96) compared to 20 for the all-bond portfolio. And, the range of returns is wider for stocks—from down 43% to up 54%. Conversely, bonds ranged from -8% to +46%—a much narrower range.
Sometimes, though, allocation norms go out the door. Last year was a case in point. For only the third time since 1926, stocks and bonds declined in the same year. Part of the reason for the connection was that U.S. stocks and U.S. bonds (both governments and corporates) have a high negative sensitivity to unexpected inflation. In other words, they both fall when unexpected inflation spikes.3
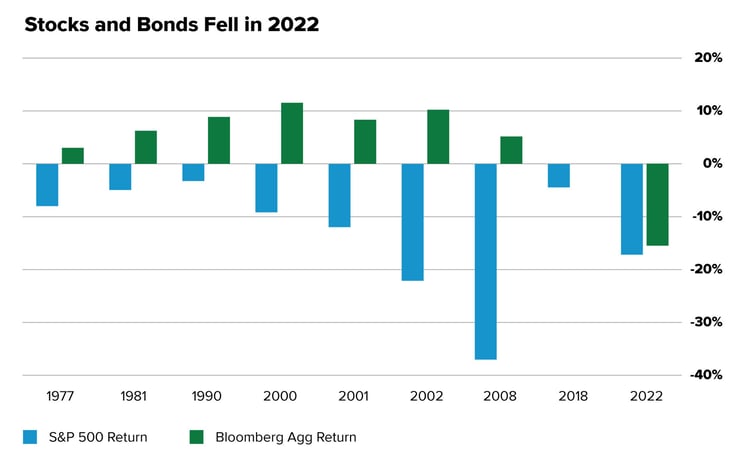 Source: Standard & Poor's, Bloomberg, L.P. Chart shows the performance of U.S. large-cap stocks (S&P 500) and U.S. corporate and government bonds (Bloomberg Agg) during down U.S. stock market years.
But getting asset allocation right is not just a decision between stocks and bonds. A host of sub-asset classes within each may be appropriate for you. For example, you can choose between large and small companies or ones in the U.S. versus those outside the U.S. Also, you may select stocks that pay a regular dividend or bonds that pay a coupon. There are many choices, and each has distinct characteristics that may make it appealing for your needs. Below we identify three we think are exciting sub-asset classes right now.
All of this shows that asset allocation is important, but there is not one that's right for everyone. However, there usually are choice combinations for your situation. And understanding your risk from three angles—propensity, capacity, and tolerance —is critical in selecting the right combination for you.
We highlight risk because when it is misidentified, investors tend to make rash decisions in the presence of adversity that often can negatively impact future wealth accumulation. In other words, during a strong up market, most investors tend to have the “I laugh in the face of risk” attitude and take on too much risk. But in a down market, they typically run for the hills—sell when stocks are down and hide their cash under a mattress. But after identifying and implementing the appropriate risk, investors often tend to be more comfortable with staying the course and riding the ups and downs.
Reevaluate stock positions
Holding the "best" securities within your chosen asset allocation also contributes to returns. But what does "best" mean, especially in a down market?
There’s a notion that investors should not sell their downtrodden holdings during a decline because they will lock in those lower prices and lose the opportunity to capitalize on a market recovery. That is a fair assessment and a time-tested strategy that works when you have time to wait for a market upswing AND you still believe in those companies.
But there is also a tactic of reviewing your holdings, looking for previously unavailable opportunities, and cutting out dead weight when your investment thesis has changed. For example, in 2022, the speculative parts of the equity markets—those companies that were unprofitable primarily because they relied on cheap financing to grow their businesses but still bulldozed their way to high market valuations—repriced to reflect the true nature of their businesses. If those are in your portfolio, they’ve probably declined a lot. But should you continue to hold them? Maybe there’s a better option for your investment dollars.
In sum, locking in losses so you can sit on the sidelines will not allow that money to generate gains when the market turns up. But trimming or selling out of positions to upgrade to what you believe to be higher quality, long-term holdings is a tactic that can take advantage of current market conditions.
This refinement and selectivity are reasons why active managers have the potential to outperform during down markets. For example, one study found that more active funds outperformed least active ones by 4.5% to 6.1% per year in down markets (between 1980-2008) after adjusting for risk and expenses. It also found that “the sources of fund performance suggests that active funds show better stock picking skills in the down markets.”4 Likewise, similar findings arose from another study of over 1,000 actively managed U.S. funds from 1995 through 2020. On average, they consistently beat the Russell 1000 index in falling markets. The top 25% of managers bested the market 60% of the time, while the top 5% topped it 75% of the time.5
Three interesting asset classes
In addition to active management, we believe these asset classes look particularly attractive: U.S. large-cap dividend, U.S. mid-cap equity, and international equity.
- Seeking income: U.S. large-cap dividend
Before the 1990s technology revolution, dividends had been a more significant part of the return composition of stocks than they have been over the last few decades.
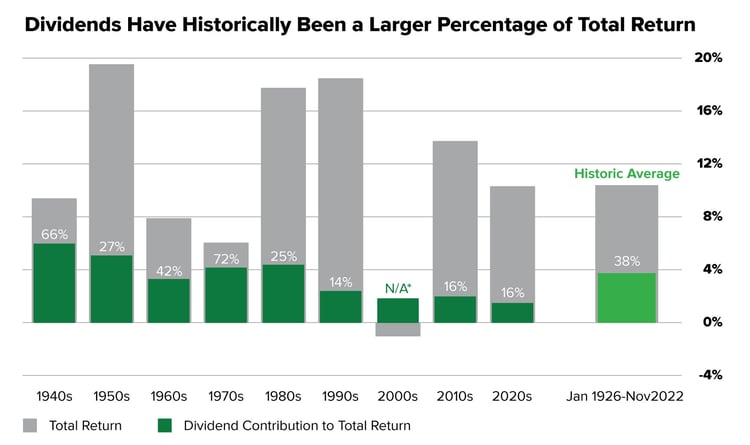 Source: Capital Group. Data sourced from S&P Dow Jones Indices, LLC. 2020s data is from Jan. 1, 1926 through Nov. 30, 2022. Data shows annualized total return. *Total return for the S&P 500 was negative for the 2000s. Dividends provided a 1.8% annualized return over the decade. Past results are not predictive of results for future periods.
Part of the shift away from dividends was due to the changing nature of the market. First, starting in the 1990s, multiple expansion influenced total returns more than dividends or earnings growth.6 Second, higher-growth companies tended to reinvest proceeds rather than pay out earnings in the form of dividends. Third, the market saw many unprofitable companies ascend due to a decade and a half of nearly free money due to near-zero borrowing rates. As a result, unprofitable companies cannot pay dividends (since they have no earnings).
Today, a different picture is emerging. First, fearful investors are seeking income in a down stock market. Many flocked to dividend-paying stocks in 2022 partly because the alternative for income—the bond market—was weak.
Second, unprofitable companies, especially those relying on free money to grow, either feel the pain or have closed shop. And higher-growth companies recognize the need to balance shareholder returns with return on investment from growth initiatives.
Our take: We think the best time to own dividend stocks is heading into a recession. But we believe it’s not just about buying stocks that pay dividends but finding growth stocks that pay dividends. We look for companies growing both their businesses and increasing their dividends—companies with brighter features ahead of them, not just companies paying out cash. That will likely provide investors with a two-pronged return profile—price appreciation of the security and income from the dividend.
- Searching for growth. U.S. mid-cap equity
U.S. mid-cap stocks are nestled in a weird place between smaller, often nascent companies and larger, household-name companies. As a result, they often get lost in the asset allocation pie as many investors flock to the well-known names or try to hit it big with a small company. But mid-caps have a unique performance history in environments similar to today.
Over the last 25 years, mid-cap stocks have outperformed large-caps in two of the previous three sustained rising rate periods, by 12.5% from 2004-2006 and 10.6% from 1999-2000. However, in 2015-2018, they underperformed by 4.7%.7
And during recessions, mid-caps also outperformed their larger peers—by 5.1% during the dot-com bust and 5.0% during the Great Recession.6
Our take: We think mid-caps have two attractive advantages over larger companies. First, mid-caps are cheap right now. The relative valuation appears attractive—currently trading at nearly two standard deviations below large caps. Through the end of 2022, the S&P 500 (large-caps) was trading at a P/E of 20x, whereas the S&P 400 (mid-caps) was trading at 14.5x. This discount is often the case because historically mid-caps have tended to get beaten up more than large-caps during a downturn, so a reversion to the mean says they may have a higher return.
Second, we expect mid-cap earnings to grow. Large-cap earnings fell 4%, while mid-cap earnings rose 11% in 2022.8 And what gives us comfort in 2023 is that mid-cap companies are more exposed to the healthier U.S. economy, unlike large caps, which have a higher exposure to overseas markets that are not faring as well, especially in Europe.
- Finding quality: International equity
Quality companies are found all over the world. Unfortunately, U.S. investors often forget they can find good companies even in challenged overseas regions. This is especially true in developed markets, where company-specific factors tend to influence returns significantly more than the sector or region. But even in emerging markets, company-specific factors are growing more influential.
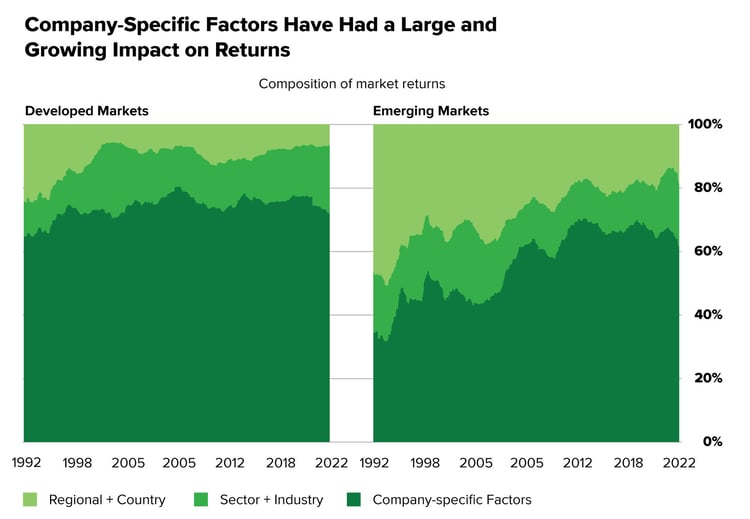 Source: Empirical Research Partners. As of Sept. 30, 2022. Analysis provided by Empirical Research Partners using their developed market and emerging market stock universes that approximate the MSCI World Index and the MSCI Emerging Markets Index, respectively. Data show the percentage of market returns that can be attributed to various factors over time, using a two-year smoothed average. Past results are not predictive of results in future periods.
And similar to mid-caps, international equity is trading at a steep discount to the U.S. market. While that is not a new phenomenon, tailwinds such as the U.S. dollar, easing of the energy crisis, and stabilizing geopolitical forces could help propel company earnings.
Another little-known fact is that three-fourths of the top-returning companies since 2013 are located outside the U.S. In 2022, many of those were in emerging markets (excluding China), while in the previous three years, Chinese companies were the drivers. So despite index returns favoring the U.S., high-quality companies exist outside the U.S. That is also why we believe a passive approach to international investing is probably not beneficial. Instead, it's all about stock picking—choosing the highest quality non-U.S. companies that can potentially outperform many lower-quality ones.
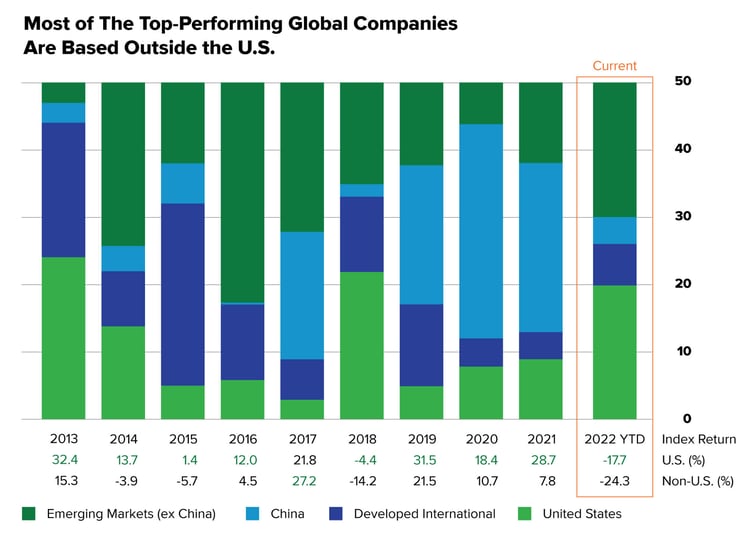 Source: MSCI, RIMES. 2022 data is year-to-date as of Oct. 31, 2022. Returns in U.S. dollars. Top 50 stocks are the companies with the highest total return in the MSCI ACWi each year. Returns table uses E&P 500 and MSCI ACWI ex-USA indexes for U.S. and non-U.S., respectively.
Our take: When discussing mid-caps, we said that Europe is not doing well. That's true. But it doesn't matter. Because as we showed earlier, company-specific fundamentals, rather than geographic orientation, often drive returns. Thus, stock picking is critical.
Additionally, since the U.S. dollar has remained strong for the most part (although it’s weakened recently) against other major currencies, many international stocks represent relative bargains and offer attractive returns for U.S. investors.
Lastly, growth expectations for this year and 2024 favor economies outside the U.S. For example, the forecasted 2023 real GDP (real growth—growth adjusted for inflation—is what you should look at with rising or high inflation) for the U.S. is 0.5%, which is slightly higher than Europe (0.0%) but far below emerging markets (3.4%), including China (4.3%) and India (6.6%).9 2024 forecasts follow the same pattern.
Short-sightedness may limit long-term growth
Investing in a down and uncertain market and economy is not easy. And unfortunately, neither we—nor anyone else—can forecast when the worst may be behind us. But what we hope we showed is that there are pockets of investments that may appear attractive. And if you step back and view the entire market, history shows that times like today do not drag down markets forever!
.jpg?width=700&height=510&name=Strong-returns-1-year-after-market-bottom%20(1).jpg) Source: Blackrock. S&P 500 drawdown and total return from the market bottom.
Source: Blackrock. S&P 500 drawdown and total return from the market bottom.
This is the third installment in our series, 2023 Outlook: Recession. Check out the first two: “Are We in a Recession?” and "Recession Obsession: How Scared Should Investors Really Be?" To learn more about U.S. large-cap dividend stocks, U.S. mid-caps, and international equity, stay tuned for our insights over the next several weeks.
Related Articles

Should You Have Bonds in Your Investment Portfolio?
88%. That’s the percentage of return that comes from asset allocation for most investors.1 So it’s...

3 Strategies to Avoid Emotional Investing
Life can be an emotional roller coaster. There are significant moments, like the joy of watching...

3 U.S. Market Trends That May Help Build Wealth
Did the 2022 market decline sour you to investing in stocks? That’s understandable. Being trigger...